Basic measurements with a Vector Network Analyser
In our wireless world the need of RF component testing is one of a key factors to bring a product to market. Devices are getting smaller and are containing more and more complex components. It is a must to have knowledge of complex impedance (or admittance) and reflection / transmission parameters to bring the most optimum functionality to the RF device. RF components like filters, resonators, etc. can be calculated according to capacitance and inductive values. Software simulators can take these values and help fine tune the design. But at the end of the day, the quality and performance needs to be measured. For several applications, a scalar network analyser might be adequate but for some specific design work phase information is required. A vector network analyser [VNA] has the possibility to measure amplitude and phase over specified frequency range.
The vector network analysis allows for the measurement of complex scattering parameter [Sxx] of a device under test [DUT] over a specified frequency range. Vector network analysis allows for the characterisation of a scattered matrix with reflection [S11] and transmission [S21] factors. These parameters are required to design e.g. a matching circuit for an amplifier. With phase information it is also possible to calculate the time range where additional failures at different positions can be analysed. Due to the complex (vector) characteristic it possible to make an accurate correction with calibration routines.
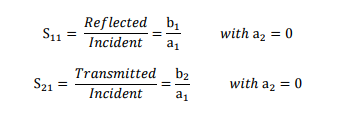
RIGOL’s VNA solution in RSA5000N and RSA3000N [RSAxN] series can perform three different measurements these include reflection [S11], transmission [S21] and Distance-To-Fault [DTF] measurements. All three of these measurements have several different views which allows engineers to easily determine a DUT’s frequency response, phase, SWR, Smith Charts and Polar Plane measurements. In figure 1 the principle of S-Parameter measurement is visible. These parameters can be calculated with the complex factors ax and bx. For example, a1 refers to the incident wave into the DUT and b1 refers to the reflected wave. The transmitted factor after DUT is referring to b2. At RSAxN version an incident wave can only be generated by port 1. Therefore, a2 is 0.
The principle of S Parameter Measurement in a network:

S11 Measurements
The reflection measurement is an important key to specifying the performance of complex systems (e.g. wireless communication system) Reflection factor r describes the ratio of incident and the reflected wave. There are several different tools that can be used to perform this measurement but one of the most useful tools is the Smith Chart because it contains the most information, like:
• Complex impedance and tools to determine how to match the (compensation of inductive / capacitive reactance)
• Complex reflection factor
• Impact of real / capacitance or inductive
• Influence of frequency range and displaying frequency response
• Q Factor of RF components
• Influence of the cable length
• Determination of cable loss
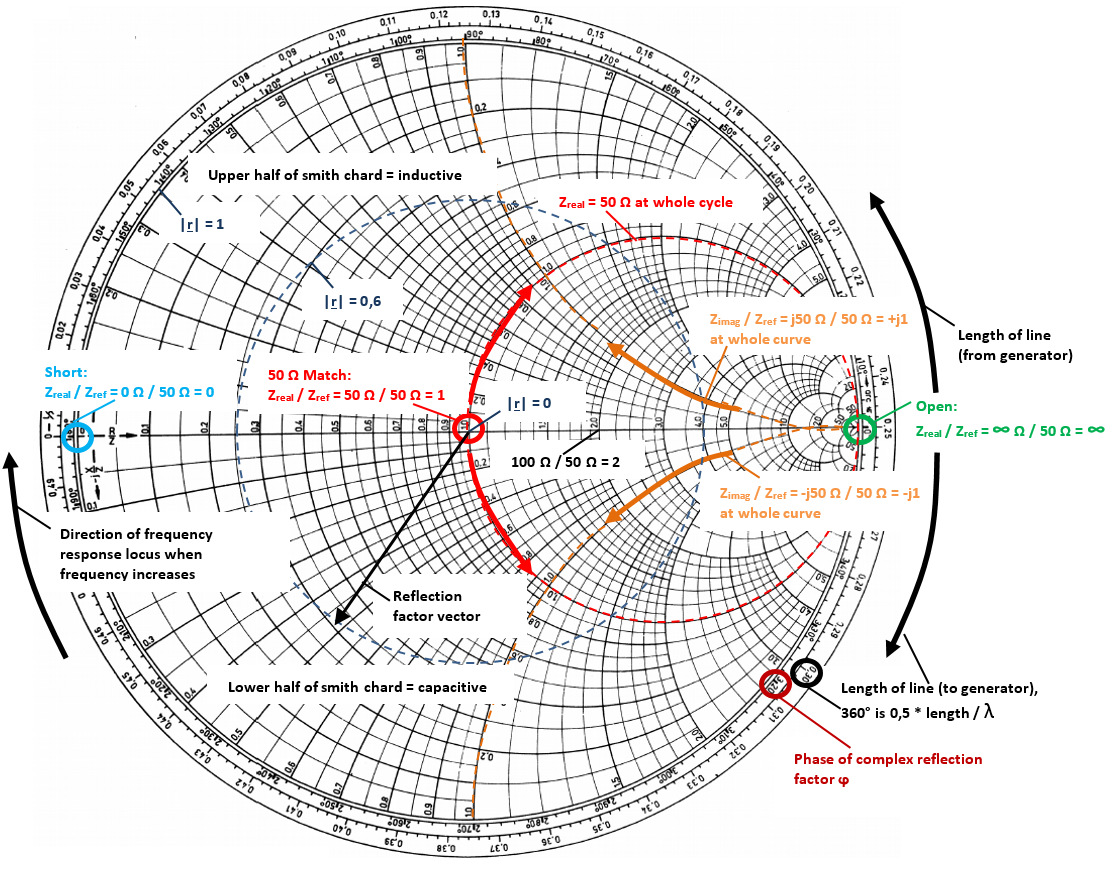
In RSAxN the Smith Chart can display impedance [Ω] (components in series) or admittance area [1/ Ω] (parallel connection of components). A universal Smith Chart is visible in figure 2. “Universal” means it can be used for each system impedance. In this example a 50 Ω reference is used (which can be modified to a different impedance, like 75 Ω if required). The reference is used to center the chart for better visualisation. A complex impedance of Z = 50 Ω + j25 Ω is transformed with that reference into 1 + j0,5 to make manual calculations easier. But in the end the calculation for real complex impedance has to be done after the measurement has been finalised. In RSAxN it is possible to measure the transformed values via a marker and display impedance value (in the example above: 50 Ω + j25 Ω).
Taking into consideration to have a serial connection of impedance, capacitance and inductivity, the impedance is calculated as follow:
In this formula it is visible that the inductive imaginary component is positive and capacitive imaginary component is negative. The lower half of Smith Chart is referring to capacitance and upper half is referring to inductance. On the outer diameter of Smith Chart, the length of line referring to Wavelength λ is displayed. On the Smith Chart it is visible that a turn of 360° results into 0.5 x l/λ. The second value which is visible on the outer diameter is the angle ϕ of a complex reflection factor r. There is a 100% reflection of incident wave with either an Open termination (right side of the chart; when the real and imaginary impedances are close to ∞ Ω) or with a Short termination (left side of the chart; when these impedances are closed to 0 Ω). In the center of Smith Chart the impedance of 50 Ω is visible. It is possible to measure out the complex reflection factor in Smith Chart, but it is easier to use a marker in the Polar Plane in RSAxN to get this value.
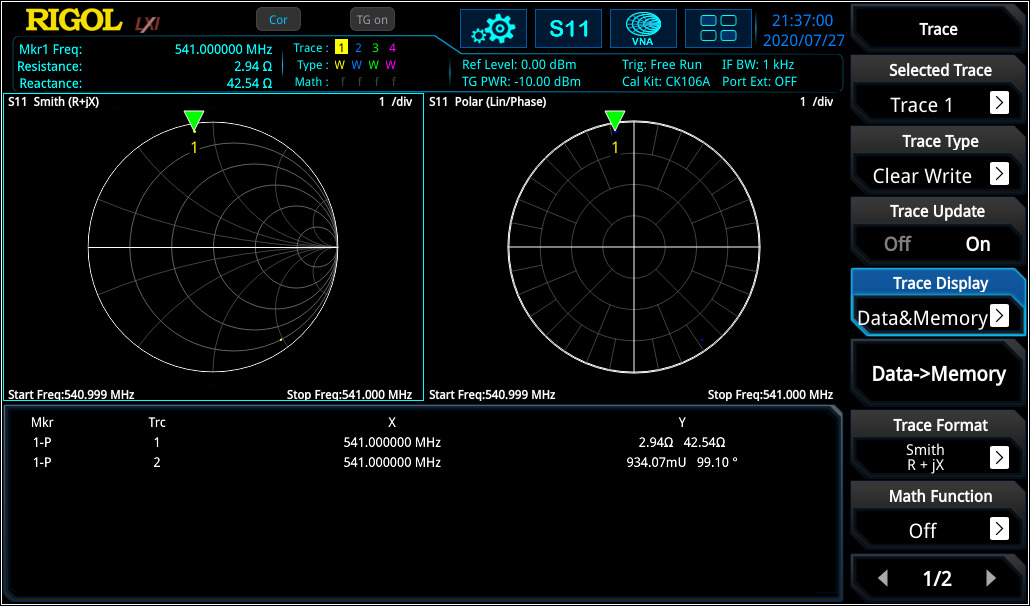
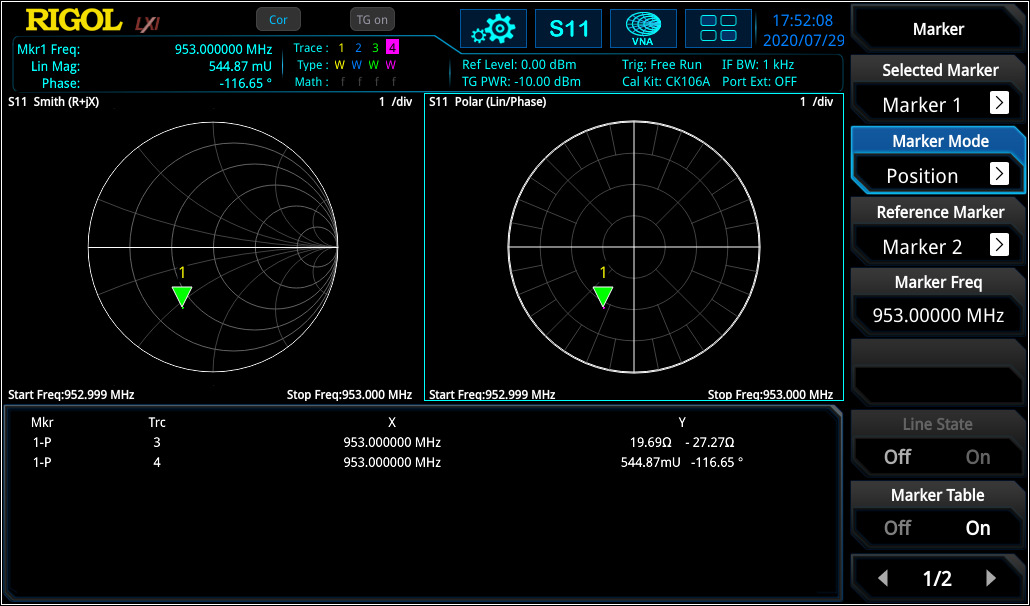
The Smith Chart and Polar Plane are useful tools to analyse complex impedance and reflection factor on a network for a specific frequency range. In figure 3 the capacitance in series with a resistor was measured at 541 MHz. The same configuration was measured again with a cable at ~16 cm. In this example it is visible that the impedance position is changing when using an additional cable at a specific frequency. The reflection factor remains very close to the origin point (cable has attenuation which has for this measurement a very small influence. As higher the cable attenuation, the more their has influence).
The marker on the Smith Chart calculates the correct impedance when using the reference of 50 Ω. Then the same configuration was tested again without the additional cable over a different frequency range (see figure 4).
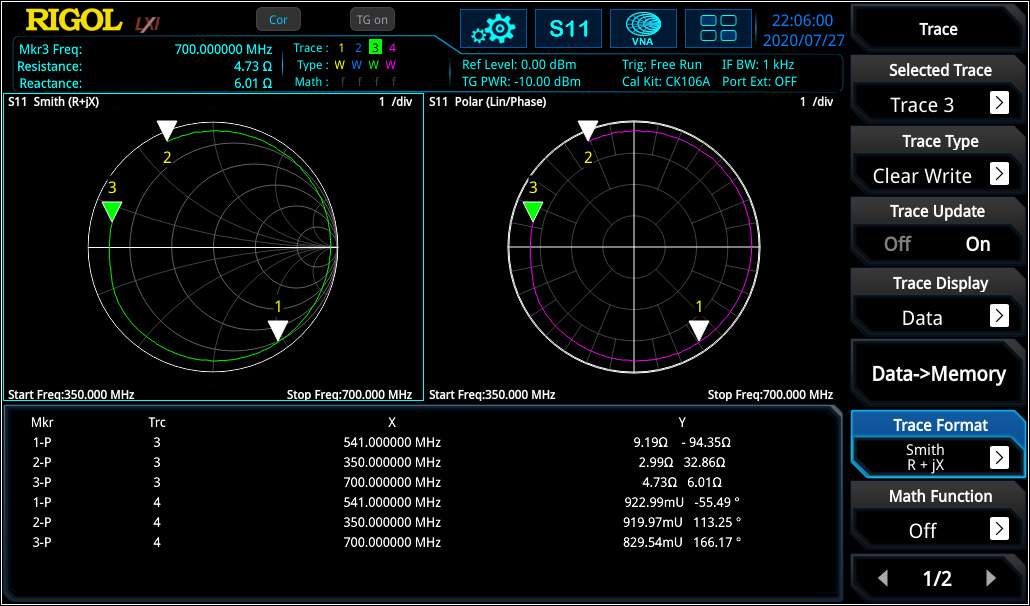
In this measurement the frequency response curve is visible for the adjusted frequency range. With the marker it is visible that the curve is moving clockwise with increasing frequency. In RSAxN version different intermediate frequency bandwidth [IF BW] can be used for testing (1 kHz to 10 MHz in 1-3-1 steps) to realise the frequency resolution as required.
For complex networks one of the top uses is of the impedance to the network (here: to realise 50 Ω at network input) at the required center frequency. Different possibilities can be used in which can be shown on the Smith Chart.
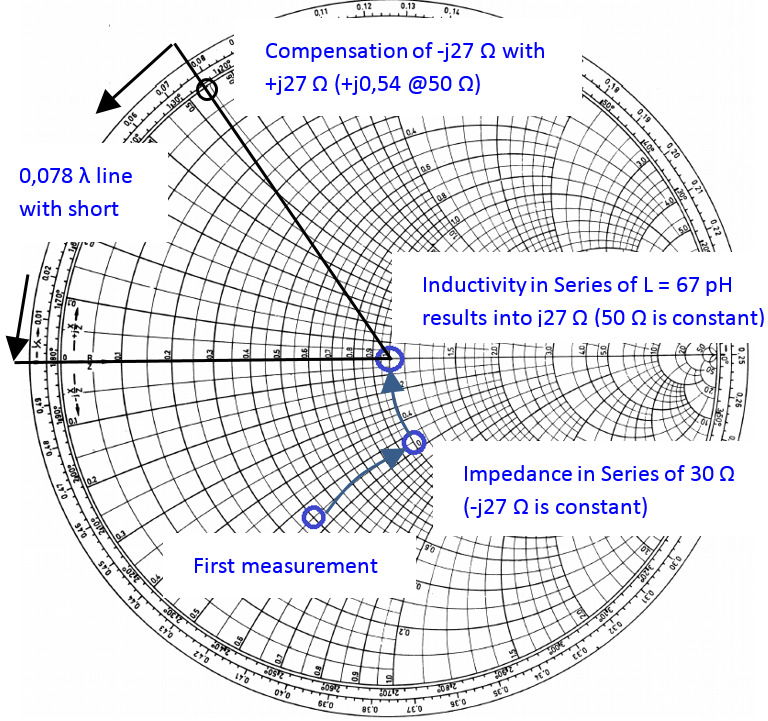
First, with a series impedance of 20 Ohm can be set to 50 Ohm. As a next step an inductive component in series could be used to bring the impedance level to 50 Ω without an imaginary component (see figure 5). The problem of this theory is that the inductive component (in this case: 67 pH) is very small and hard to realise. Discrete inductive or capacitive elements can only be used for maximum frequency of several 100 MHz. For higher frequency ranges, different methods (e.g. microstrip solutions) needs to be used. One of the approaches might be using a serial 50 Ω stub to compensate the -j27 Ω (length of stub with short: l = 0,078 λ, with open: l = 0,328 λ). For the stub, the dielectric constant is required to evaluate the correct wavelength.
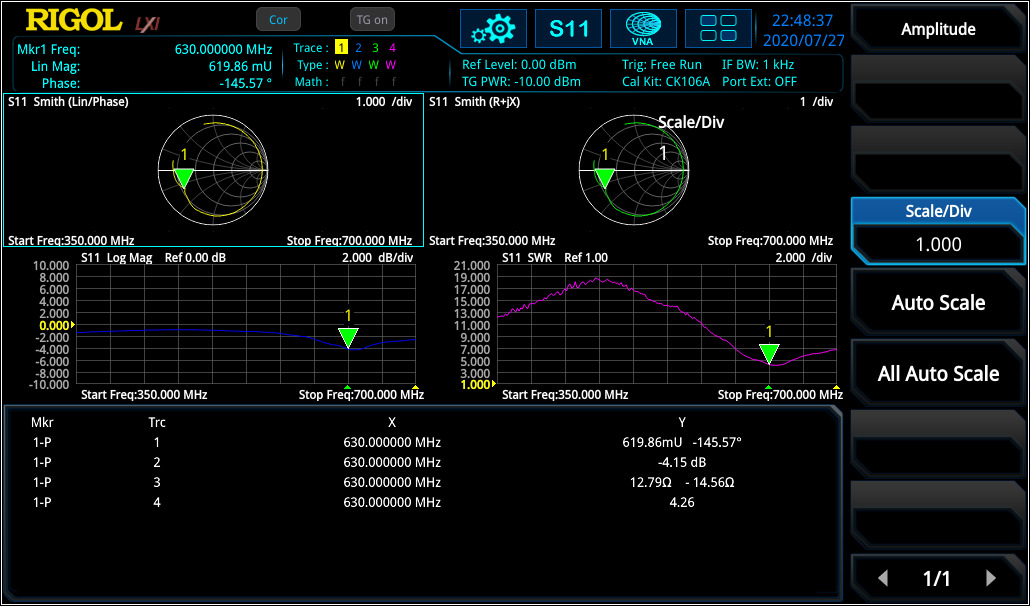
For S11 it is also possible to display return loss and (voltage) standing wave ratio [(V)SWR] over frequency range. If “V” is used, then the ratio is defined to voltage level of a standing wave at a line.
VSWR is referring to the maximum and minimum voltage values that is being transmitted and reflected by the component. The difference to reflection factor is, that there is no relation to phase.
For deeper analysis it is often necessary to use logarithmic values to have a deeper view of smaller modification compare to bigger values. In RSAxN it is also possible to display the return loss value ardB in log scale over the frequency range.
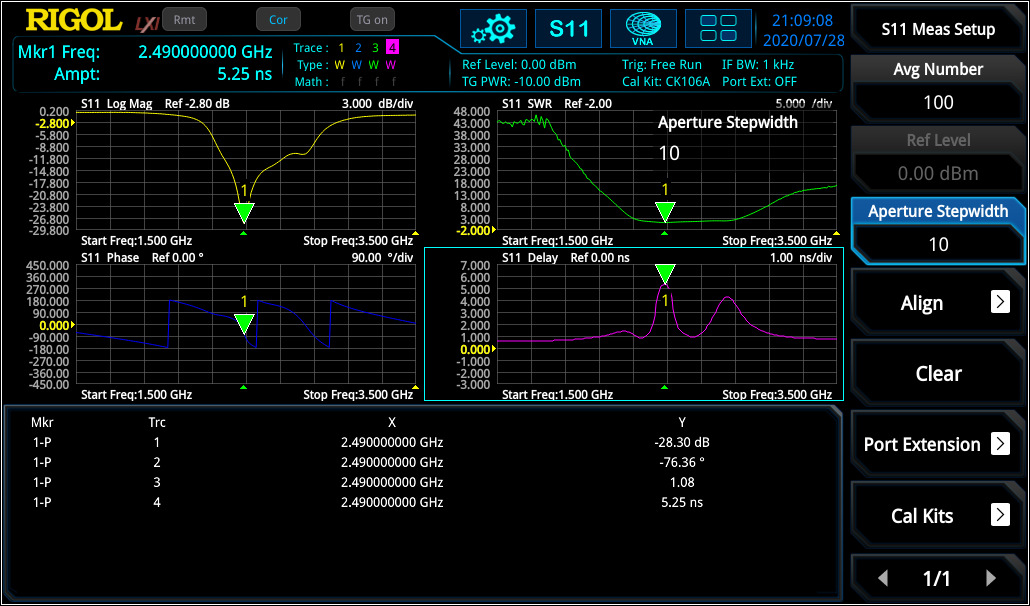
Linear distortion occurs in all linear networks and components. Linear distortion could have an impact deviation in phase, in amplitude and / or in a constant group delay. When measuring a filter with the RSAxN, it is possible to measure amplitude flatness, the deviation in phase and group delay (Group delay is a deviation from linear phase). Thereby the VNA using phase over frequency and adds it to a positive constant phase over frequency. The difference of both results is the phase deviation over frequency and the group delay is calculated as follow:
Each signal will be delayed with transmission over a component like a filter, amplifier, etc. different group delay results in a non-linear delay of signals at different frequency components and distorts the signal, which is not ideal and not desired. If the group delay is constant over the frequency range, all frequency components will have the same shift and, in that case, the ideal system would be free of distortion and the group delay would be a constant value. The aperture step width [df] can be adjusted in RSAxN according to their need. In S11 (and S21) measurement of RSAxN, phase and group delay can be measured and displayed over the desired frequency range (see figure 7).
S21 Parameter Measurements
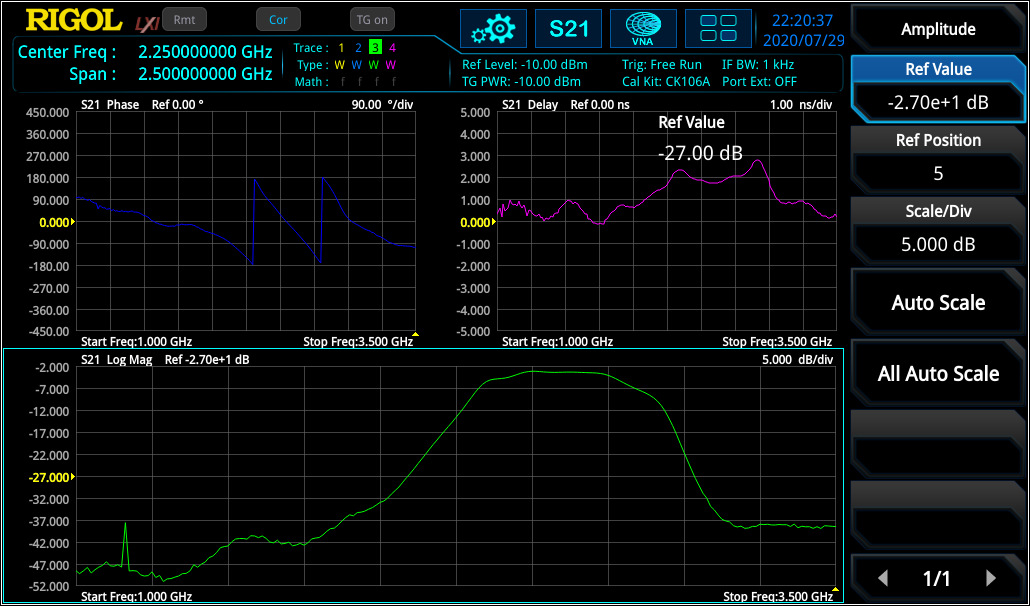
S21 parameter defines the insertion loss over a specified frequency range which can be measured with high accuracy after a Through calibration. The measurement of frequency response can be used to measure the 3 dB bandwidth of a bandpass filter (see figure 8) or characterise amplifiers.

Similar to S11 measurement, also phase over frequency range and group delay can be measured with RSAxN (see figure 9).
Distance-to-Fault Parameter Measurements
In RF measurement normally frequency range will be selected because it has more significance in characterisation in this area. For example, a filter will be characterised in frequency range. But for some cases it is very useful to take also a look into the time range to evaluate impulse response of a DUT.
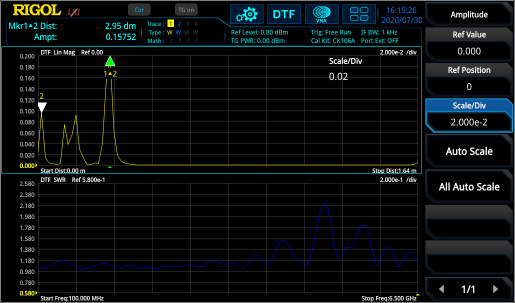
One big advantage when phase information is available is, that the frequency range can be transformed (via Inverse Fast Fourier Transformation [IFFT]) into time. The time view has different advantages, it can be used to localise a defect on cables due to measurement of impulse response, localisation and characterisation of discontinuities or getting a better view of physical characteristic of a DUT. In the formula below it is visible that S11(t) is the impulse response of reflection factor S11(ω):
Figure 10 shows the frequency range (S11) and DTF measurement of a DUT (two cables with connectors in between and a 50 Ω match at the end). In the frequency range, the discontinuities can only be captured in summary. But in DTF the reflection points are easily visible and can the exact distance of reflection points (e.g. due to connectors or cable defects) can be measured with marker. It is necessary to perform the same calibration like for S11 measurement.
Calibration
One important part of accurate measurements is the calibration procedure. Each measurement contains different failure mechanisms, with calibration routines these can be minimized, and the quality of measurement accuracy can be increased.
S11 / DTF Calibration:
D = Directive Error: coming from imperfect signal split of coupler.
MS = Source Match Error: coming from imperfect source matching of VNA
TR = Tracking Error: coming from frequency response of components used for signal split (like directive coupler) and mixer and internal detector.
Here is an error model for a one port measurement:

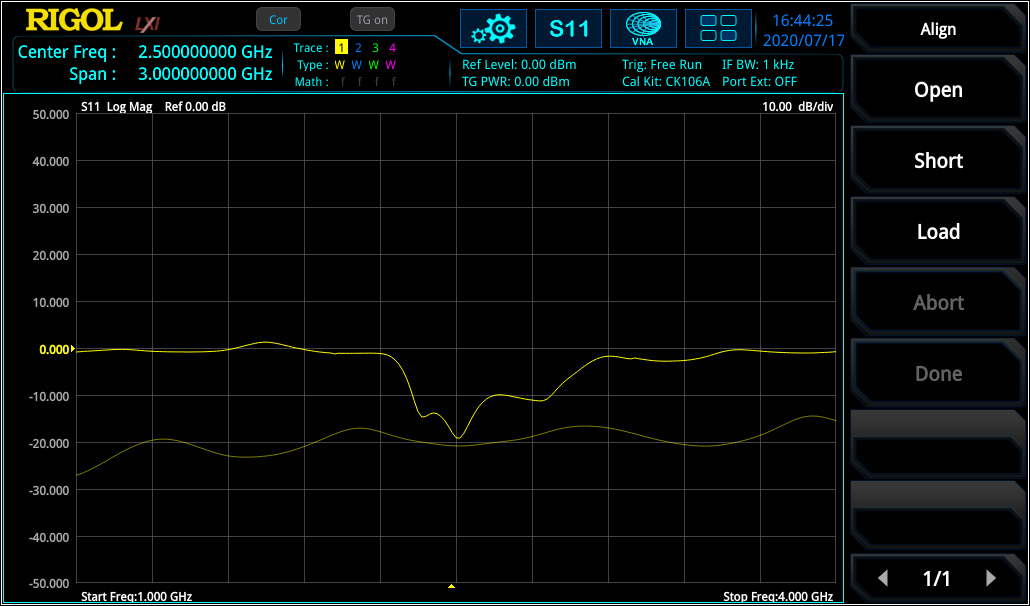
Load calibration: With using a 50 Ω impedance [load], S11A is 0 and S11M = D (Directivity Error from directivity coupler is measured). VNA is now minimising the directivity error [D] over the adjusted frequency range. After this calibration, the directivity error of RSA5000N is ~40 dB.
Short / Open calibration: From the DUT’s view there is a mismatch of source [MS] which creates a reflection loop between the DUT and the system. This failure is visible when the DUT shown a mismatch. Additionally, the frequency response failures [TR] due to connectors, cables, internal coupler, detectors occurring. With open (S11A = 1) and short (S11A = -1) calibration there will be two equation with two factors Ms and TR and the VNA knows these values.
The calibration standards Open / Load / Short and Through should be ideal to reach e.g. with Short r = -1, but they aren’t. E.g. an Open contains stray capacitances or Short contains inductivities. This is not a problem, when the non-ideal behaviour of standards is known. For RIGOL’s calibration kit CK106A (DC – 6.5 GHz) and the CK106E (DC – 1.5 GHz) the parameters are known and already integrated into the RSAxN versions. With regards to these values an accurate calibration is now possible. If an additional calibration kit is used, then these parameters needs to be customized according to this kit.
For DTF measurement, the velocity factor of cable (e.g. 70% 0.7) and the cable loss needs to be integrated to extend the accuracy of the measurement. Both values are defined in cable specification.
S21 Calibration:
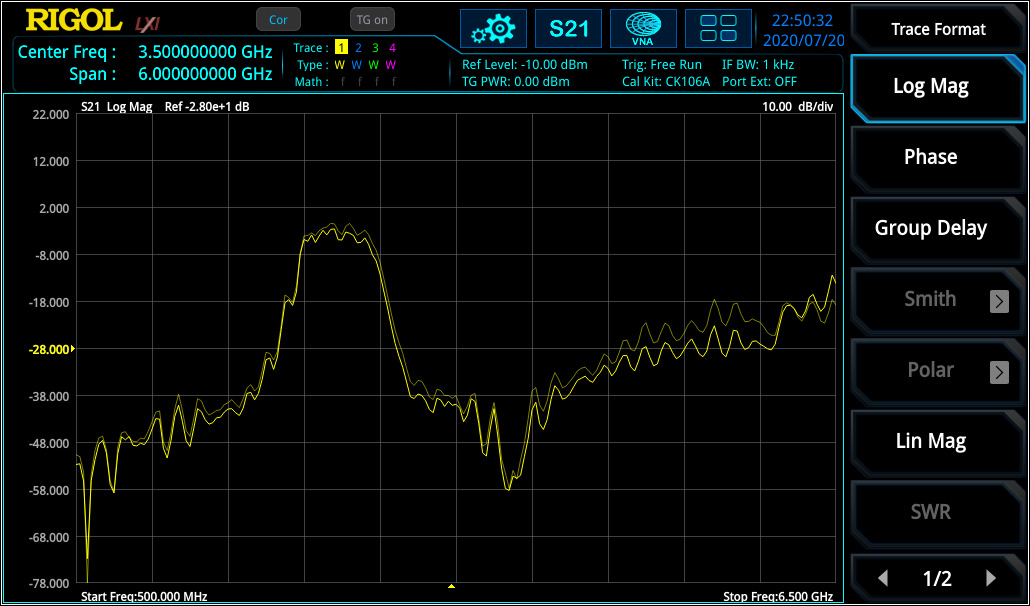
For S21 (transmission factor) measurement, a Through calibration is required to flatten the frequency response of cabling and connection (needed to connect DUT to VNA) from VNA source to VNA input. Figure 13 displays the curve before and after Through calibration.
The RSA5000N and RSA3000N series have four additional application modes, in addition to the new VNA function. These four modes include RTSA (real-time spectrum analyser up to a maximum bandwidth of 40 MHz), GPSA (sweep-based spectrum analyser with outstanding performance), EMI (pre-compliance tests according to CISPR specifications) and VSA (vector signal analysis for different digital demodulation and bit error measurement, only RSA5000N). With the addition of the VNA application mode the RSA5000N and the RSA3000N series are some of the most complete RF testing platforms on the market.
Products Mentioned In This Article:


