Real-Time Spectrum Analyser vs Spectrum Analyser
Today the RF industry has to face more and more the open question, how to transport the data from my test device (DUT) to different receiver spots (like to transmit data into World Wide Web). For IoT applications the most common way is, to use wireless transmission of data via common standards like Bluetooth, Wi-Fi or Zigbee. A more complex test system than a spectrum analyser is required to evaluate the results in a short time. Wireless transmission works with digitalisation of data. These digital data will then be modulated to an RF carrier via complex modulation schemes. This process results in a very fast and dynamic signal change over time and frequency band. Speed becomes more and more an important factor in frequency analysis. So it is not enough to use a sweep based spectrum analysers with FFT or superposition principle. Rigols new outstanding Real-Time Spectrum Analyser RSA5000 series will give the answer to that question and combines an elegant design with full flexibility and speed during test.
RSA5000 series can be switched between a common superposition spectrum analyser [SA] and a real- time spectrum analyser [RT-SA]. The RSA5000 is working like a SA of the DSA800 series but with better RF performance. This document will describe the difference of analyser techniques and will display the advantages:
The complete RF input signal will be set to an intermediate frequency via a swept local oscillator in superposition technique. In other words a signal trace of SA will be sweep between start / stop frequency according adjusted center frequency and span. Sweep time is depending of adjusted parameter like RBW, VBW, Span. This measurement technology can be perfectly used to get a fast overview of a wide range spectrum with good amplitude accuracy and for insertion loss or VSWR measurements. Additionally a common SA is a very useful tool to perform RF measurements with a big dynamic range and good performance.
For measurement of low level signals it is important to have a good dynamic range. Some standards have a low reference sensitivity level below -120 dBm which is lower than the noise level. Therefore it is necessary to have a test device with possibility to decrease the noise level as low as possible. The DANL of Rigols RSA5000-SA is specified with -165 dBm/1 Hz (typ.)1. Low signal measurements can be performed with following parameter adjustments2.
The negative aspect is that only the sweep point is measuring at a time. The rest of the trace is not updated at the same time. With SA blind time occurs where signal information is lost (see figure 1).
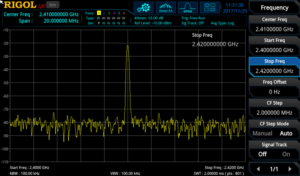
Sweep result of spectrum analyser with blind time
For example a fast changing frequency hop signal like Bluetooth can be measured with SA. One trace can be set to maximum hold. A second trace can be set to clear write. With one sweep it is not possible to capture all signal components. Several sweeps are necessary and they are only visible with maximum hold function (see figure 2). But not all frequency components are visible. There is no time information available and it is not possible to detect that this signal is a frequency hopping spread spectrum signal.
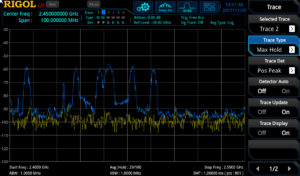
Figure 2: Bluetooth signals are only visible via max hold function with SA
Signals which are only randomly available and very fast cannot be detected. Frequency, Span and RBW has a direct influence to sweep time on common spectrum analyser. If a better frequency resolution is required, then RBW needs to be decreased. This results in a lower sweep time and capturing of fast signals is more difficult and time consuming.
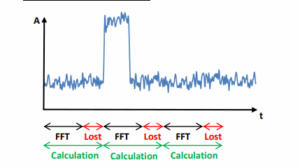
The real-time spectrum analysis uses FFT technology and works without a sweep. But the calculation form is different comparing to normal FFT. In normal FFT form, calculation time needs more time than FFT process. The result is, that some parts of time signal will be lost based on the gap between the FFT acquisitions (see figure 3, below). For example this kind of FFT analysis can’t be used for measurement of pulsed signals because part of pulses could be in the gap between FFT acquisition and the frequency result will be different with each FFT acquisition.
Normal FFT Analyser example:
In real-time acquisition the calculation will be performed in parallel to FFT process and the calculation itself is very fast. The calculation is faster than FFT acquisition and contents all operation until displaying the trace to the display. The display data will be changed with very high and constant speed. The result is that time acquisition of different FFT blocks is gap free (see figure 4 below). Speed will be not changed with using of different RBW adjustment.
Gap free FFT example in real-time operation:
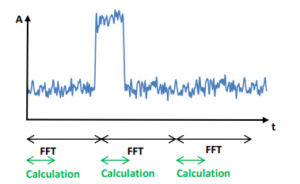
Figure 4: FFT in Real-time spectrum analyser without gaps
A fixed number of 1024 samples are used for one FFT time acquisition. Each FFT calculation is using a window function. Windowing is important to define a discrete number of time points for calculation. Size of window can be varied and is not fixed in time domain. A variation of window size will have a direct influence of real-time resolution bandwidth [RBW] or the other way around: with changing the RBW, size of window will be changed.
Slew rate, sharp of window and number of window points has an influence to leak effect3, frequency- and amplitude accuracy. Therefore several windows are available in RSA5000 series to use the device for a wide range of applications.
Negative aspect of a filter is, that some signal information will be lost due to amplitude suppression at begin and end of a filter (see figure 5).
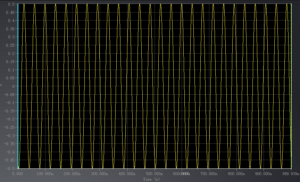
Figure 5: unfiltered time signal but with lost amplitude information
The position of a time signal like a pulse needs to be in the center of FFT window to transform it correctly into frequency range. In case that a pulse is in between two FFT events, then amplitude is suppressed by filter side loops and is no longer correct (see figure 6).
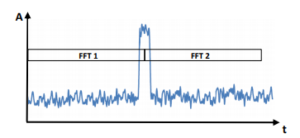
Figure 6: Amplitude is wrong if signal is located in between of two FFT blocks
An overlapping process of FFT events will be used in RSA5000 series to avoid losing signal information. Overlapping has the effect that more spectrums are available over a time period and time resolution is higher. Smaller events can be measured (see figure 7) and signal suppression of single FFT acquisition occurred due windowing is eliminated with overlapping.
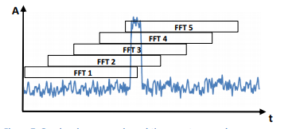
Figure 7: Overlapping process in real-time spectrum analyser
In other words, overlapping process of FFT events has a direct influence of smallest pulse width which can be measured with a real-time spectrum analyser. The RT-SA RSA5000 is working with a FFT rate of 146.484 FFT/sec. which results into a calculation speed (Tcalc) of 6,82 µsec.:
Depending on real-time span there are 4 different sample rates available. The maximum sample rate is 51,2 MSa/sec4. With that sample rate and the fixed number of samples (NFix = 1024), used for one FFT acquisition, the duration can be calculated as follow:
An overlap of FFT frames is not possible during calculation progress. Therefore the overlapping time of FFT frames can be calculated with that formula:
𝑇𝑜𝑣𝑒𝑟𝑙𝑎𝑝 = 𝑇𝑎𝑐𝑞 – 𝑇𝑐𝑎𝑙𝑐
For example with sample rate of 51,2 MSa./sec. the overlap time is 13,18 µsec or 65,86% which results into NOverlap = 674 sample points.
Probability of Intercept [POI]
POI specify the smallest pulse duration which can be measured with 100 % amplitude accuracy. Furthermore POI defines the minimum pulse width where each pulse will be captured (see figure 8). The smallest POI of RSA5000 is 7.45 µsec5.
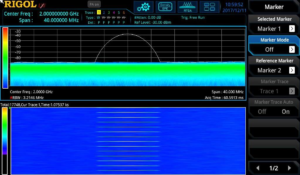
Figure 8: Measurement of a pulse of 7.45 µsec. (period: 1 sec.) with amplitude of -35 dBm. Each pulse is captured with correct amplitude.
These small pulse events can’t be measured constantly with a normal SA. A RT-SA is necessary for that kind of short events. RSA5000 can measure a minimum event of 25 nsec., but not with 100% amplitude accuracy and not all pulses will be measured (see figure 9).
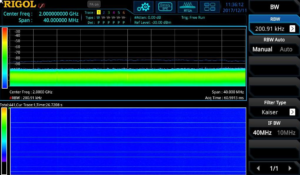
Figure 9: Measurement of a pulse of 25 nsec. (period: 1 sec.) with amplitude of -35 dBm. Not all pulses are captured. Amplitude is wrong amplitude.
POI depends on FFT rate, used RBW and adjusted Span. The principle of POI is described with a span of 40 MHz (=51,2 MSa/sec.) and RBW of 3.21 MHz (Kaiser Window) in figure 10. Due to calculation time, second FFT acquisition starts after 6.82 µsec. Window size is depending of RBW in real-time mode:
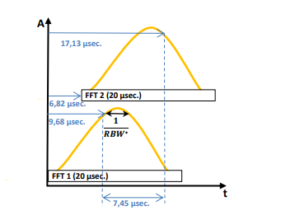
Figure 10: Example with RT-Span of 40 MHz, sample rate of 51.2 MSa/s and RBW of 3.21 MHz (Kaiser Filter)
With that POI and speed it is now possible to measure a Bluetooth signal with the RT-SA mode of RSA5000 series. Usage of maximum hold is no longer needed. It is possible to set 6 different RBW settings in RT-SA mode and speed is not affected. RSA5000 provides different measurement modes for the analysis:
- Normal Trace Analysis
- Density Analysis
- Spectrogram
- Power vs Time
In normal mode the trace information of current time is visible. It looks like a trace of a SA but due to the real-time sweep more information is visible at the same time compare to SA. Normal trace analysis is a 2D measurement (power over frequency).
Density Analysis is the same result like normal trace analysis. But with density analysis it is additionally possible to analyse the repetition rate of a signal. Density is working with a colour scheme (from blue = 0% to red = 100%, see figure 8). As more often the signal hits a single pixel point within a certain time, as higher is the percentage which defines the colour of this pixel. For example a constant wave [CW] signal would be visible in red colour. A very short single signal event would be visible in blue colour. The colour percentage can be calculated as follow:
This could be a signal with a pulse width of 30 msec. With acquire time of e.g. 60 msec. n = 50% which would be result into the colour ‘yellow’ (see figure 11, below). The normal trace in density has the colour white. Density analysis is a 3D measurement (power over frequency over repetition rate).
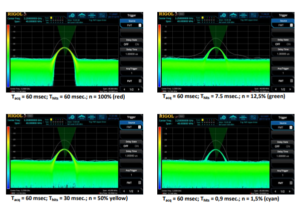
Figure 11: Density example with colour scheme examples
In normal and density mode it is possible to activate a spectrogram measurement. Spectrogram is a waterfall measurement frequency over time and bring the possibility to measure out duration of pulses (like for Bluetooth signals). A spectrogram also works with a colour scheme for signal level (DANL: 0% = blue, Reference level: 100% = red). With waterfall spectrogram it is possible to analyse on / off scenarios of signals. Density in combination with spectrogram is a 4D measurement (power over frequency over repetition rate and power over time, see figure 12 with a Bluetooth example).
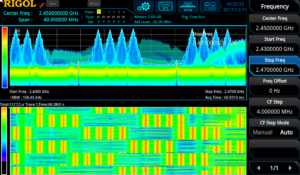
Figure 12: Bluetooth signal measured with density spectrogram
In Power vs Time (PvT) it is possible to display the time domain of a signal within adjusted real-time bandwidth. The acquisition time can be changed in this measurement. The Power vs Time analysis is displayed for the used real-time bandwidth and not to RBW like in SA with zero-span configuration. Signal bursts of modulated signals and pulses can be displayed to measure duty cycle and amplitude of a pulse or to display pulse trains over certain time. PvT can be used in combination of normal trace analysis (frequency spectrum) and spectrogram (see figure 13).
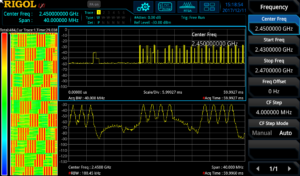
Figure 13: normal trace vs spectrogram vs PvT of a Bluetooth signal
Comparing the measurement result of Bluetooth signal in figure 12 and figure 13 and the result of SA (figure 2) test engineer has much more information available now. Within the adjusted real-time bandwidth all frequency components can be measured. Time information can be displayed in parallel of spectrum measurement. In spectrogram it is visible that this signal is a frequency hopping spread spectrum signal and the length of data block can be analysed. The Power vs Time is no longer depended on RBW bandwidth like in SA and frequency domain and time domain can be displayed in one time.
Products Mentioned In This Article:


